Inaccurate Study: NBER
National Bureau of Economic Research published a working paper in 2019, asserting that Purdue’s decrease in OxyContin marketing efforts in select triplicate states was directly correlated to a decrease in overdose deaths. This theory has been debunked.
2023 Academic Paper Dismantles 2019 Triplicate Study
“… the introduction and marketing of OxyContin accounts for some percentage of the increase in deaths from opioids, but only as part of the broad increase in the use of all prescription opioids that occurred from 1991 to 2012”
“Its results and conclusions, particularly the claim that the introduction of OxyContin explains 79 percent of the change in opioid deaths from 1996 to 2017, should not be accepted.”
“… the conclusions about the effects of the triplicate prescription program are suggestive at best.”
Origins of the Opioid Crisis Reexamined, March 2023[1]
2019 Triplicate-State Myth
Debunking National Bureau of Economic Research’s False Conclusions Regarding OxyContin Marketing in States with Triplicate Prescribing Laws
NBER Theory
When OxyContin launched in 1996, five states—California, New York, Texas, Illinois and Idaho—required doctors to write prescriptions for Schedule II narcotics in triplicate.
NBER’s 2019 study, Origins of the Opioid Crisis and its Enduring Impacts, claims that, at the launch of OxyContin, Purdue Pharma reduced its marketing to triplicate states.
The study asserts that this purported difference in 1996 marketing is the only explanation as to why triplicate states have seen lower cumulative overdose rates than other states for all drugs over the following two decades.
This theory is questionable on its face and the NBER report suffers from fatal flaws rendering this premise worthless:
- An unsupported premise
- Ignorance of other factors
- Use of unreliable and inaccurate data
1. Premise is Unsupported
The NBER study presumes that Purdue deliberately avoided triplicate states when launching OxyContin.
But the authors acknowledge that early marketing documents they obtained merely “suggest” that Purdue would target less marketing in triplicate states.[2] The study concedes that “we do not have data that breaks down Purdue Pharma’s initial marketing spending by state”[3], and instead offers conclusions about Purdue’s marketing strategy based upon inference and speculation.
Further, the authors acknowledge that all five states eliminated their triplicate programs within five years of OxyContin’s launch, and they admit there were no increases in volumes or overdose deaths after the programs ended, as would be expected if there really were meaningful marketing differences in those states.
2. Ignorance of Other Factors:
Accepting NBER’s theory requires one to believe that there were no other factors that could affect prescription volumes or overdose rates as between different states.
Of course, this is objectively untrue. The opioid crisis is a multifaceted problem that affects states and regions in different ways:
- Price & competition
- Impact of triplicate programs
- Media, publicity and word-of-mouth
- Shifting pain treatment guidelines, treatment philosophies and standards
- Medicaid enrollment patterns
- Overdose trends before 1996
- Availability of opioid-targeted treatment facilities
- Access to healthcare
- Medicare Part D launch
- Geographic impacts of heroin and fentanyl waves
- State policy variations
Example: Media Mentions & Word of Mouth
Growth in Opioid Deaths vs 1999 Deaths/100K Baseline
“OxyContin” Media Mentions
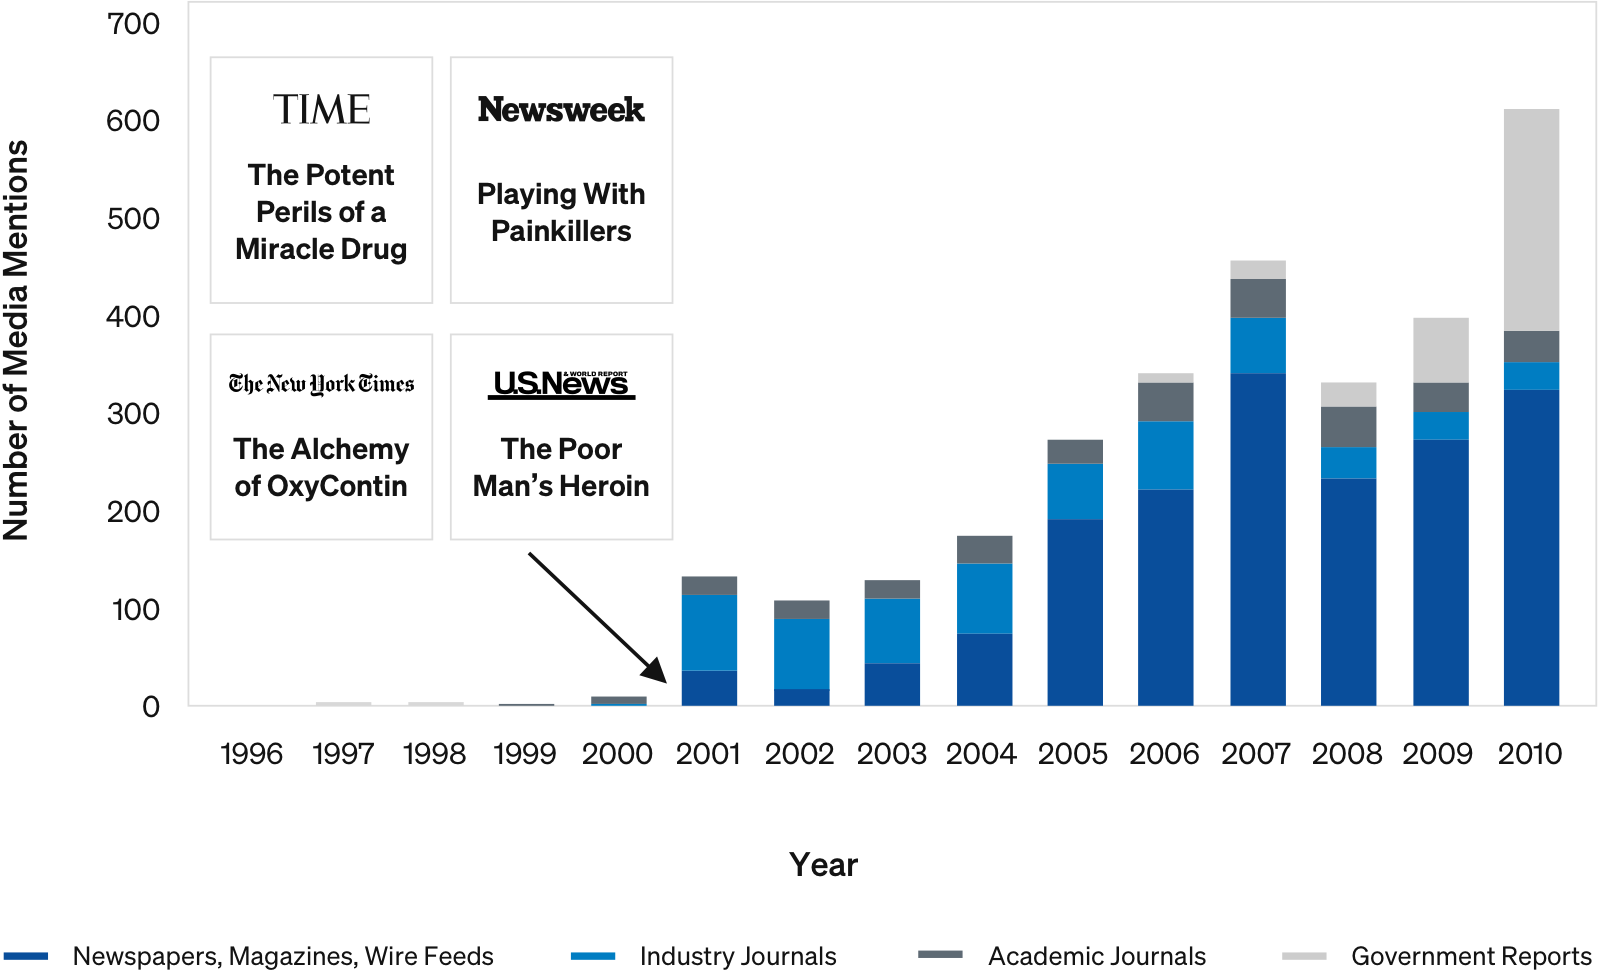
Media attention and word of mouth appears to have been a key factor in spreading opioid abuse and overdoses geographically, independent of triplicate state status.
Case Study: How Prescribing Practices Affect Volume
US oxycodone Dispensing Directly by Doctors: 2006-2012
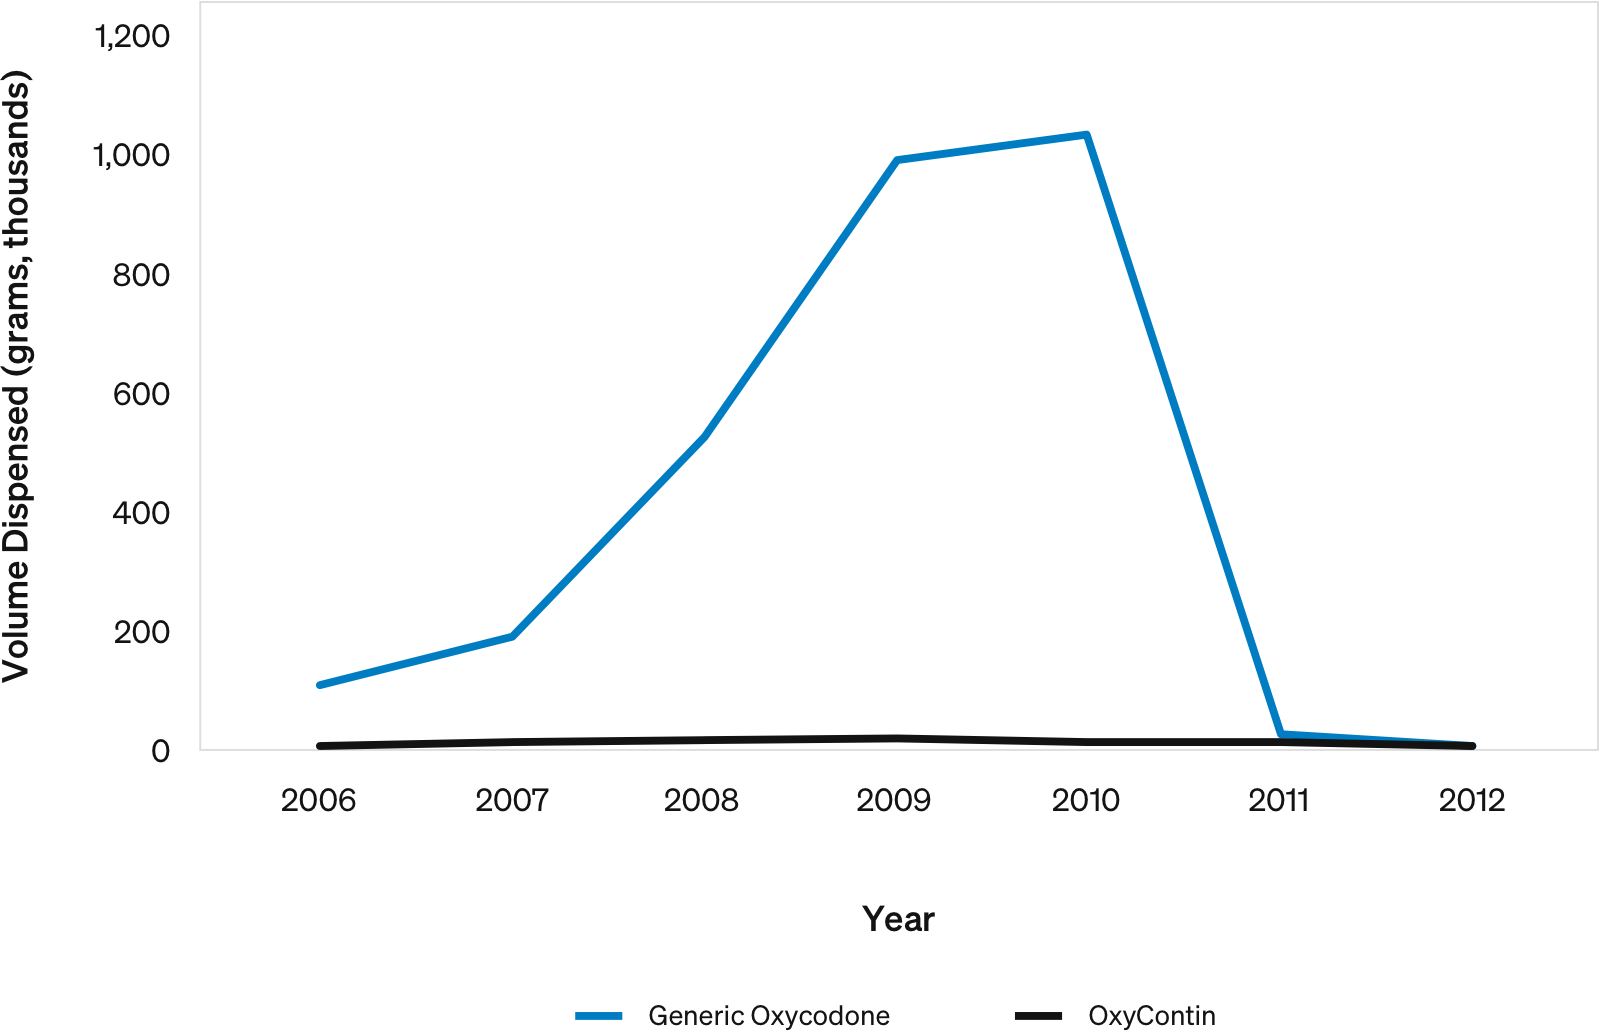
In 2010, Florida prohibited doctors from directly dispensing controlled substances.
- Florida accounted for nearly all oxycodone direct dispensing in the US (~1M grams)…the volume disappeared overnight.
- While some volume likely moved to pharmacies, some was likely improper prescribing.
OxyContin was a very small portion of the total volume.
- 99.6% was generic oxycodone: OxyContin was only 0.4%.
This shows how a single rule change in one state can dramatically affect prescription volumes. Variations in state policies clearly matter.
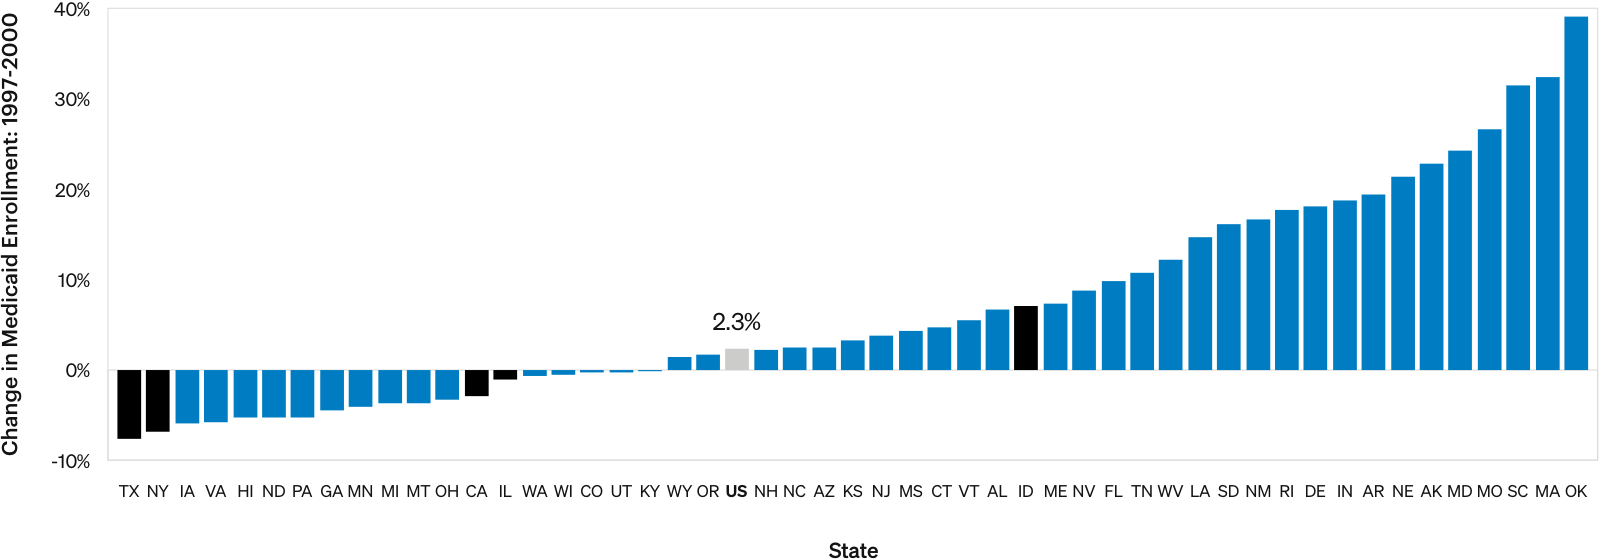
Example: Paying for Prescription Drugs
Four out of five triplicate states saw decreased Medicaid enrollment in the years preceding OxyContin launch. The authors do not consider the extent to which an increased population of patients who might have to pay out-of-pocket for OxyContin suppressed prescriptions.
3. NBER Data is Unreliable & Inaccurate
Remarkably, the study is missing prescribing data for the critical OxyContin launch period, between 1996 and 1999.
- For this period, the authors merely infer OxyContin volumes from other sources.
- While the authors attempt to excuse this lack of data by correlating other sources to ARCOS data, their correlation (0.53) is insufficient to be meaningful.
The NBER’s own data (fig. 6) shows that triplicate and non-triplicate overdose rates began to diverge in 1993, not when OxyContin was launched three years later. This strongly suggests that Purdue’s marketing (even if it was different in triplicate states) was not the cause.
CDC coding of overdose deaths makes it impossible to accurately pinpoint prescription opioid overdoses, and data does not permit isolation of OxyContin from other substances.
- CDC coding changed in 1999 (ICD-9 vs. ICD-10); authors cannot confidently compare trends.
The authors fail to account for the fact that the difference between triplicate and non-triplicate state prescribing trends appear to be driven by New York and California.
- Picking California or New York, together with four random, non-triplicate states, yields results similar to the NBER study.
- “California’s opioid death rate is among the nation’s lowest. Experts aren’t sure why.”[4]